
An Overlay for R6:Siege
R6 Analyst has a variety of different features all aimed at helping you rank up higher in Siege.
With R6 Analyst you can
The R6 Analyst app tracks how you play in real-time, and uses this data to give tips and advice on what to focus on improving. This way it acts as your own personal coach!
For example: The app may detect that you keep losing your Prep-Phase drone, much more often than normal. It can then gently remind you to keep this valuable utility safe for use later in the round, when you can actually act on the intel it provides!
Current App Users
Matches Tracked
Players Tracked
Defuser Plants Tracked
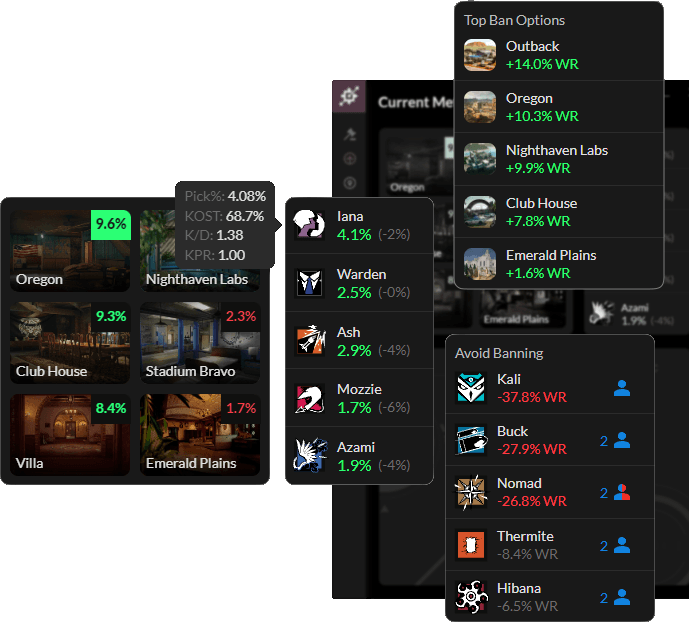
Grab valuable information before the match, whilst you're queueing, and during the banning phases!
Before every match you can
The R6 Analyst app uses the data it has tracked to know what Maps and Operators you prefer, as well as that of your teammates and enemies. It then uses that information to generate recommendations for what Maps and Operators to ban!
For example: The app may detect that you keep losing to players using Osa on Skyscraper, and that neither you nor your teammates use her much at all. It can then recommend you ban Osa for this match, improving your chances of winning!
Very informative and feature rich enough to satisfy even the most demanding analysts.

This might be the single best overlay I've used for Siege and has 100% helped me win ranked games I otherwise might not have. This app features information on both map and operator bans, helping to put you on your best map or your opponents worst map. My favorite feature is the built in cheater reporting, where if you send a report in game, R6 Analyst will generate a report template which you can submit to Twitter or Siege's support website, which is very helpful for getting cheaters or abusive players banned quickly.

Great addon for siege that has alot more features than others I have used. Developer is super friendly and active. Would recommend to anyone looking for a good Siege overlay.

Great, intuitive analyst application! Shows tons of useful stuff and has helped me better understand the game. Developer is incredibly responsive to issues in the discord and is an all around great guy! <3

I love the advanced stats, and the Discord RPC. Very useful app.

The best designed of the Siege overlays, with unmatched customizability, effective surfacing of relevant info, and a unique ability to export match data in CSV or JSON format, which enables you to run your own analysis of data. But you'll probably find very little lacking with the apps built-in analysis options, which again are unmatched by other Siege overlays.
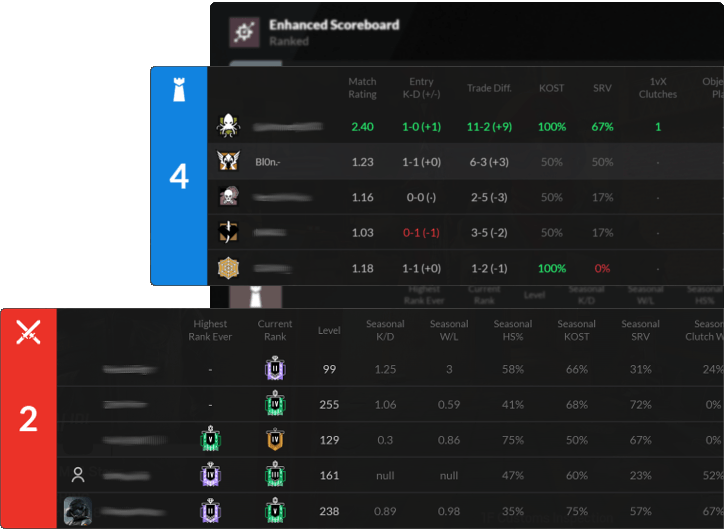
View the Account Statistics for everyone in the lobby, and a live tracked overview of performance statistics.
The Enhanced Scoreboard will let you
The Enhanced Scoreboard overlay shows you all the Account Stats you could want, including a reliable indicator showing the likelihood a player is a cheater! Additionally, it shows you Pro-League level performance metrics tracked during the match.
For example: Halfway through the match, you can quickly check the Enhanced Scoreboard to see that you are very low on Traded Kills. This can be a great indicator and reminder to stick close to a teammate when roaming, so you can be traded out when you die.
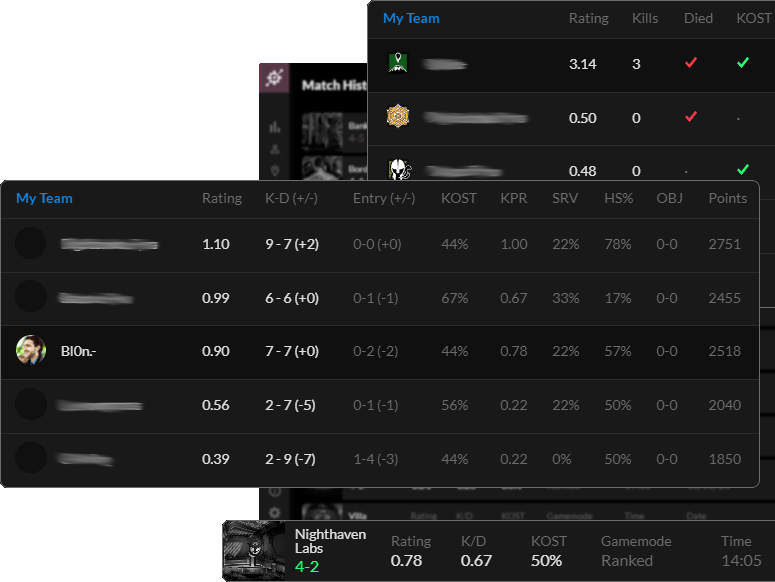
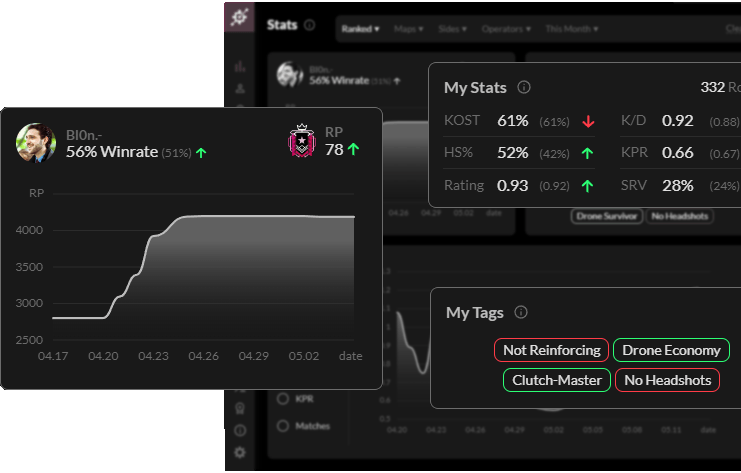
Post Match, you can review what happened, and see personalized advice and tips on what aspects of gameplay to focus on for next time!
Constantly improve and climb the ranks
The R6 Analyst app will generate "Focusses", which highlight specific gameplay areas that your performance has been lacking in. Additionally, after every round, it will very swiftly pop up to give some compliments and feedback on how you're performing so far.
For example: The app might detect that you are never reinforcing, or that you are constantly using Red Pings. It will then gently remind you of how to do better in these areas, and critically, why it is important to do these things well.
The future of R6 Analyst
I originally built the app as a way of proving that my contributions to the team (as a Thermite main) were just as valuable as our Fraggers.
The original concept development took less than two months, and contained Operator Ban Recommendations, and a rudimentary Enhanced Scoreboard.
Over the next year, weekly updates occurred.
A large portion of the features available in the app today, were conceived in this time.
The first major overhaul of the app's design.
Although the "backend" logic of the app was kept the same, the entire front-end UX/UI design of the app was improved with this version release.
Over the next two years, I kept on improving and regularly releasing updates to the app.
The update release schedule dropped to once per month, as opposed to once per week, but a large number of the more qualitative improvements occurred in this time.
After half a year of hard work, a new major release was finally ready!
I built this new version entirely from scratch. Using all the lessons learned from the past three years, I rewrote every single line of code, and we redesigned every single app page to be pixel-perfect.
There were four main design objectives for this new version:
Iterative Improvements
Continued development
The following features are already in development, and will release in the upcoming months:
In addition, now with both R6Tab and R6DB down permanently, I'm looking to get R6 Analyst up-and-running as an alternative public R6 Profile Stats web presence by end-of-year 2024. Meaning you can visit the website and view account stats on any Siege user, though I'll mainly focus on PC players only, as that is for whom my app tracks data.
I want R6 Analyst to become the go-to app if you want to improve and become a better Siege player.
My hope is that with continued development (and your valuable feedback!) I can build a system that helps any player, from any skill level, to keep striving and get better at the game!